 |
| Home │ Audio
Home Page |
Copyright © 2016 by Wayne Stegall
Updated September 2, 2016. See Document History at end for
details.
One-Bend Amplifier
Part 4: Improvements include lower
hum
Introduction
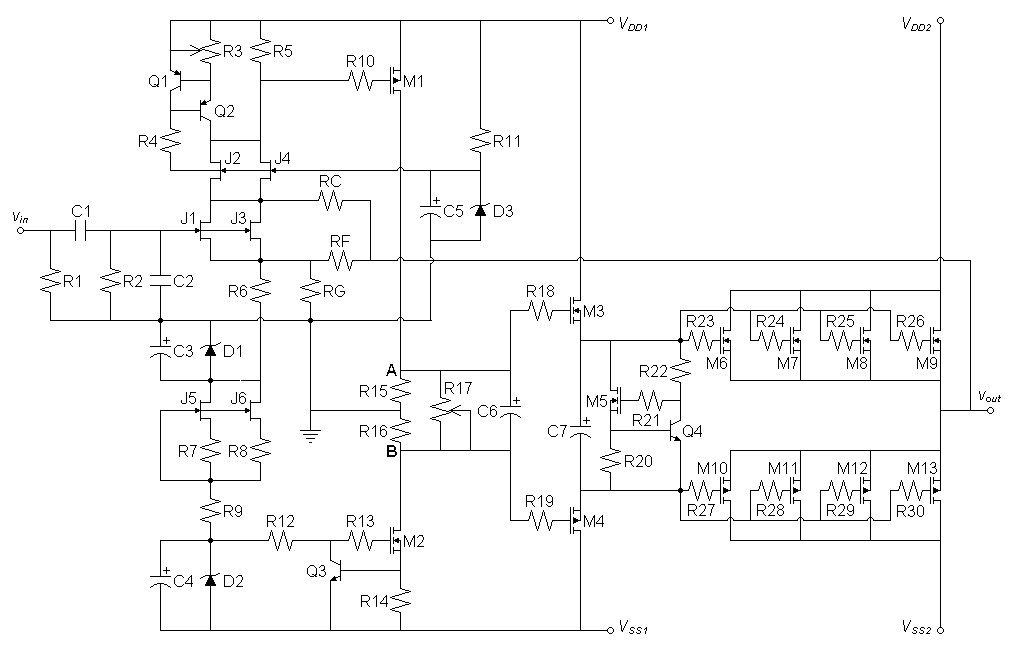
After the number of output transistors was increased to eight to improve the thermal analysis it was deemed also that an improvement in hum was likely if the inner feedback loop returned to the cascode of the first stage rather than directly to the second. Therefore I deemed it necessary to implement the changes and re-validate the SPICE analysis. Circuits and analysis follow.Circuits
Note: Component values can be obtained from the SPICE models for now.| Figure
1:
Amplifier
Schematic |
 |
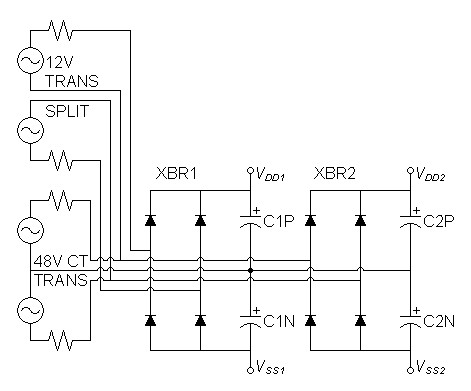
| Figure 2: Unregulated power supply |
 |
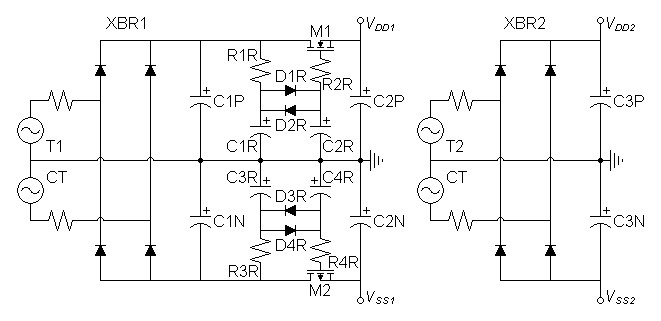
| Figure 3: Regulated power supply |
 |
Spice Results
Begin hum measurements with unregulated supply to first two stages
Fourier analysis for vout:
No. Harmonics: 16, THD: 67.8647 %, Gridsize: 200, Interpolation Degree: 3
| Harmonic | Frequency | Magnitude | |
Decibels |
|
|
|
|
|
|
| 1 | 120 | 0.00295888 | -50.5775 | |
| 2 | 240 | 0.00144109 | -56.8262 | |
| 3 | 360 | 0.000940647 | -60.5315 | |
| 4 | 480 | 0.00066636 | -63.5258 | |
| 5 | 600 | 0.000506254 | -65.9126 | |
| 6 | 720 | 0.000385225 | -68.2857 | |
| 7 | 840 | 0.00030367 | -70.352 | |
| 8 | 960 | 0.000233349 | -72.6399 | |
| 9 | 1080 | 0.000184023 | -74.7026 | |
| 10 | 1200 | 0.000138508 | -77.1705 | |
| 11 | 1320 | 0.000106726 | -79.4346 | |
| 12 | 1440 | 7.62605E-05 | -82.354 | |
| 13 | 1560 | 5.59989E-05 | -85.0364 | |
| 14 | 1680 | 3.58895E-05 | -88.9007 | |
| 15 | 1800 | 2.37921E-05 | -92.4713 |
Calculate total hum from apparent THD.
| (1) |
vhum = vhum1 × (1 + THDapparent) = 0.00295888 × (1 + 0.678647 ) = 4.96692mV |
| (2) |
vhum = 20log(4.96692mV) = -46.0783dBV |
Because hum is higher than suspected, go back to supply regulating first two stages and analyze again
Fourier analysis for vout:
No. Harmonics: 16, THD: 74.2546 %, Gridsize: 200, Interpolation Degree: 3
| Harmonic | Frequency | Magnitude | |
Decibels |
|
|
|
|
|
|
| 1 | 120 | 9.80761E-07 | -120.169 | |
| 2 | 240 | 4.71169E-07 | -126.536 | |
| 3 | 360 | 3.25877E-07 | -129.739 | |
| 4 | 480 | 2.36987E-07 | -132.506 | |
| 5 | 600 | 1.93989E-07 | -134.244 | |
| 6 | 720 | 1.59653E-07 | -135.936 | |
| 7 | 840 | 1.37583E-07 | -137.220 | |
| 8 | 960 | 1.20571E-07 | -138.375 | |
| 9 | 1080 | 1.06839E-07 | -139.425 | |
| 10 | 1200 | 9.66625E-08 | -140.295 | |
| 11 | 1320 | 8.76482E-08 | -141.145 | |
| 12 | 1440 | 8.05205E-08 | -141.882 | |
| 13 | 1560 | 7.44112E-08 | -142.567 | |
| 14 | 1680 | 6.9202E-08 | -143.198 | |
| 15 | 1800 | 6.45515E-08 | -143.802 |
Calculate total hum from apparent THD.
| (3) |
vhum = vhum1 × (1 + THDapparent) = 9.80761e-07 × (1 + 0.742546 ) = 1.70902µV |
| (4) |
vhum = 20log(1.70902µV) = -115.345dBV |
Now that hum is acceptable continue with distortion analysis at 1kHz.
Fourier analysis for vout:
No. Harmonics: 16, THD: 0.0152017 %, Gridsize: 200, Interpolation Degree: 3
| Harmonic | Frequency | Magnitude | |
Norm.Mag | |
Percent | |
Decibels |
|
|
|
|
|
|
|
|||
| 1 | 1000 | 21.1954 | 1 | 100 | 0 | |||
| 2 | 2000 | 0.00321471 | 0.00015167 | 0.015167 | -76.382 | |||
| 3 | 3000 | 0.000216674 | 1.02227E-05 | 0.00102227 | -99.8087 | |||
| 4 | 4000 | 1.73009E-05 | 8.16258E-07 | 8.16258E-05 | -121.763 | |||
| 5 | 5000 | 1.55152E-06 | 7.32006E-08 | 7.32006E-06 | -142.71 | |||
| 6 | 6000 | 1.34958E-07 | 6.36731E-09 | 6.36731E-07 | -163.921 | |||
| 7 | 7000 | 2.64258E-08 | 1.24677E-09 | 1.24677E-07 | -178.084 | |||
| 8 | 8000 | 3.92902E-08 | 1.85372E-09 | 1.85372E-07 | -174.639 | |||
| 9 | 9000 | 2.10337E-08 | 9.92371E-10 | 9.92371E-08 | -180.067 | |||
| 10 | 10000 | 1.5393E-08 | 7.26245E-10 | 7.26245E-08 | -182.778 | |||
| 11 | 11000 | 1.76767E-08 | 8.33989E-10 | 8.33989E-08 | -181.577 | |||
| 12 | 12000 | 4.92896E-09 | 2.32549E-10 | 2.32549E-08 | -192.67 | |||
| 13 | 13000 | 3.43396E-08 | 1.62014E-09 | 1.62014E-07 | -175.809 | |||
| 14 | 14000 | 2.99262E-08 | 1.41192E-09 | 1.41192E-07 | -177.004 | |||
| 15 | 15000 | 2.39516E-08 | 1.13004E-09 | 1.13004E-07 | -178.938 |
Validate the remainder of the design.
| Figure 4: Stability analysis showing 85º of phase margin. |
 |
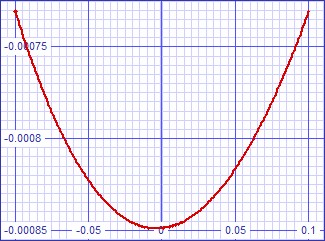
| Figure
5:
Small
signal
error
curve. Shows dominance of second harmonic. |
|
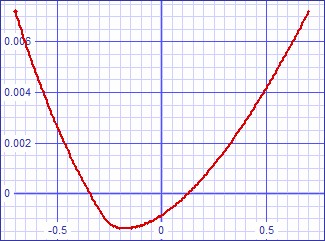
Figure
6:
Large
signal
error
curve. Shows dominance of second harmonic then third. |
 |
 |
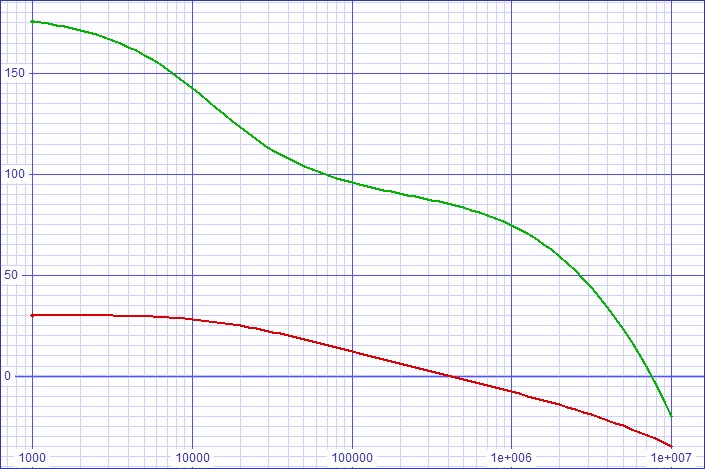
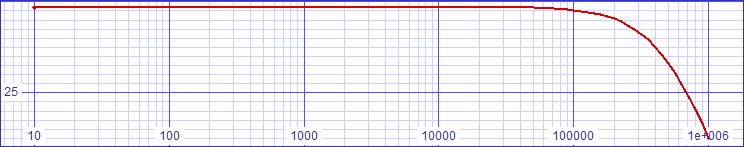
| Figure
7:
Bode
shows
frequency
response
down
3dB
at
495kHz |
 |
Conclusions
Hum is considerably improved relative to the last implementation with regulation however not enough to be rid of the regulators altogether. The remainder of the analysis remains as good as before.|
|
1Note: Raw Fourier
analysis data has been processed in spreadsheet to calculate related
results and reformatted.
2See related article: Thermal Design Part 2.
3See related article: Floating Source-follower Regulator.
Document History
August 20, 2016 Created.
August 27, 2016 Added note to get component values from SPICE
models added missing equation numbers for calculations.
September 2, 2016 Minor correction to caption to figure 7.