 |
| Home │ Audio
Home Page |
Copyright © 2018 by Wayne Stegall
Created May 15, 2018. See Document History at end for
details.
|
|
One-Bend Amplifier
Part 5: Set bias for class B/AB and
evaluate results
Introduction
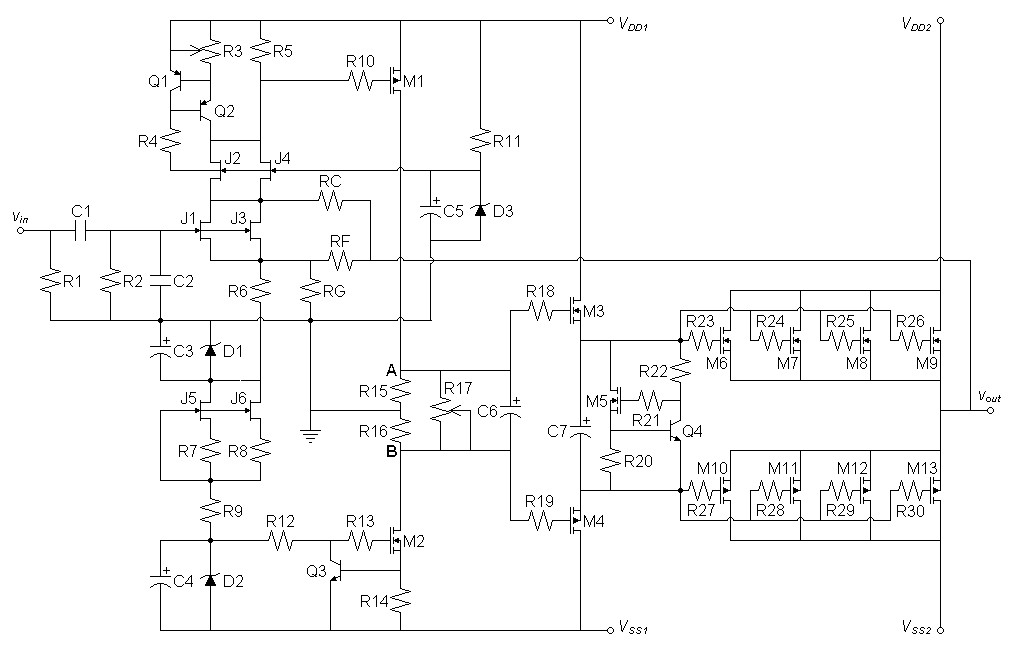
Because class-a amplifiers are so inefficient and often low-powered, I thought it would be interesting if the one-bend amplifier would produce similar results in an efficient class b. Now in class-b more power is possible so I sought to raise the power supply voltage to the output stage to 60V and the driver stages to 75V to support 250W into 4Ω with 50% headroom. Note that this is an evaluation not a redesign, if the results are acceptable the input and driver stages would possibly be adjusted to ensure that no components are out of their safe ranges in a later exercise.Circuits
Note: Component values can be obtained from the SPICE models for now.| Figure
1:
Amplifier
Schematic |
 |
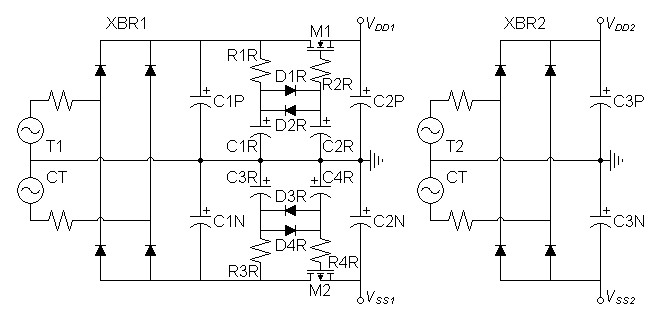
| Figure 2: Regulated power supply |
 |
|
|
Spice Results
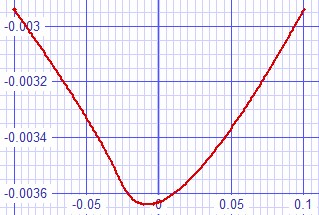
Forgo hum analysis for now. Instead begin with error transfer curves.
| Figure
3:
Small
signal
error
curve. Shows dominance of second harmonic and some third. |
|
Figure
4:
Large
signal
error
curve. Shows dominance of second harmonic then third. |
 |
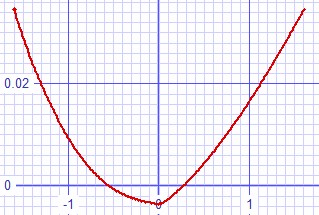 |
These error curves plotted with convergence difficulties. I think the following distortion analysis would suggest that they are smoother than they appear.
Continue with full-power distortion analysis at 1kHz.
Fourier analysis for vout:
No. Harmonics: 16, THD: 0.0408884 %, Gridsize: 200, Interpolation Degree: 3
| Harmonic |
Frequency | |
Magnitude | |
Norm. Mag | |
Percent | |
Decibels |
|
|
|
|
|
|
|
||||
| 1 | 1000 | 44.7200000 | 1.0000000 | 100.0000000 | 0.00 | ||||
| 2 | 2000 | 0.0181631 | 0.0004062 | 0.0406151 | -67.83 | ||||
| 3 | 3000 | 0.0019576 | 0.0000438 | 0.0043776 | -87.18 | ||||
| 4 | 4000 | 0.0003447 | 0.0000077 | 0.0007708 | -102.26 | ||||
| 5 | 5000 | 0.0004991 | 0.0000112 | 0.0011161 | -99.05 | ||||
| 6 | 6000 | 0.0000647 | 0.0000014 | 0.0001448 | -116.79 | ||||
| 7 | 7000 | 0.0003209 | 0.0000072 | 0.0007176 | -102.88 | ||||
| 8 | 8000 | 0.0000362 | 0.0000008 | 0.0000808 | -121.85 | ||||
| 9 | 9000 | 0.0002477 | 0.0000055 | 0.0005538 | -105.13 | ||||
| 10 | 10000 | 0.0000288 | 0.0000006 | 0.0000644 | -123.83 | ||||
| 11 | 11000 | 0.0001972 | 0.0000044 | 0.0004410 | -107.11 | ||||
| 12 | 12000 | 0.0000240 | 0.0000005 | 0.0000537 | -125.40 | ||||
| 13 | 13000 | 0.0001604 | 0.0000036 | 0.0003588 | -108.90 | ||||
| 14 | 14000 | 0.0000208 | 0.0000005 | 0.0000465 | -126.64 | ||||
| 15 | 15000 | 0.0001320 | 0.0000030 | 0.0002952 | -110.60 |
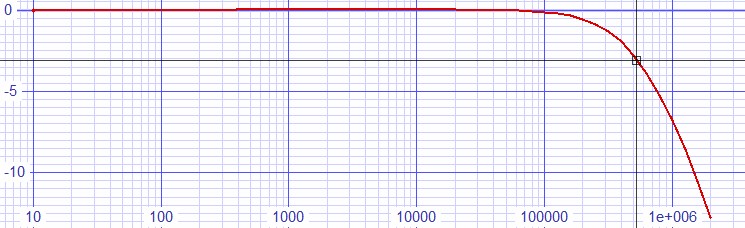
Certainly we are interested in frequency response
| Figure
5:
Bode
shows
frequency
response
down
3dB
at
524kHz |
 |
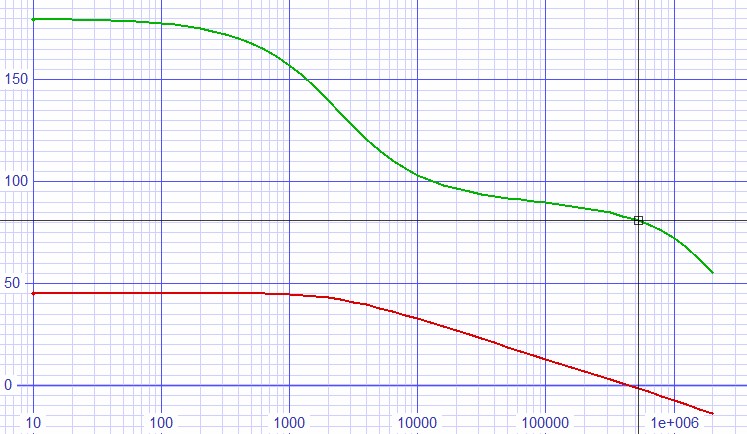
For stability the open loop phase margin at the closed-loop -3dB frequency should be more than 45º.
| Figure 6: Stability analysis showing 80.9º of phase margin. |
 |
|
|
Conclusions
The desired predominance of second harmonic expected as a result of the inner feedback loop is the same as the previous class--a result. After that the harmonic profile does not taper off like class-a but rather odd-harmonics are preferred perhaps an expected result. Perhaps a less pure class-a sound would result than previously. I think the class-b version is worth further investigation.|
|
1Note: Raw Fourier
analysis data has been processed in spreadsheet to calculate related
results and reformatted.
3See related article: Floating Source-follower Regulator.
Document History
May 15, 2018 Created.