 |
| Home │ Audio
Home Page |
Copyright © 2011 by Wayne Stegall
Created October 2, 2011. See Document History at end for
details.
Apples and Oranges
A Simple Proof that Class-A and
Class-B Distortion Specifications Are not Comparable
Introduction
Traditional standards for specifying amplifier distortion require specification at maximum rated RMS power. By these standards, it seems odd that higher distortion class-a amplifiers can subjectively sound clearer than lower distortion class-b1 amplifiers of the same power. Lets do the math and find out what is behind this seeming discrepancy.Class A Analysis
Class A distortion is due entirely to transfer curve shape.
Because polynomials can be fitted to any curve, a transfer curve could
be represented by the following polynomial:| (1) |
|H(v)| = k0 + k1v + k2v2+ k3v3 + k4v4 + ... + knvn + ... + k∞v∞ |
Also consider that for many reasons the second order term could reasonably presumed to dominate the characteristic polynomial:
- Euphonic design tends to emphasize the second order term.
- Individual transistor curves contributing to transfer curves are predominantly second order.2
For simplicity, presume a second order error only for the signal+error voltage equation:
| (2) |
|H(v)| = v + kv2 |
Divide error by signal to get relation of distortion to voltage:
| (4) |
Dist(v) = |
kv2
v |
= kv |
Where
| (5) |
v = |
PR |
Make substitution to show relation of distortion to power
| (6) |
Dist(P) = k |
PR |
| Figure 1: Class A distortion rises with power until onset of saturation |
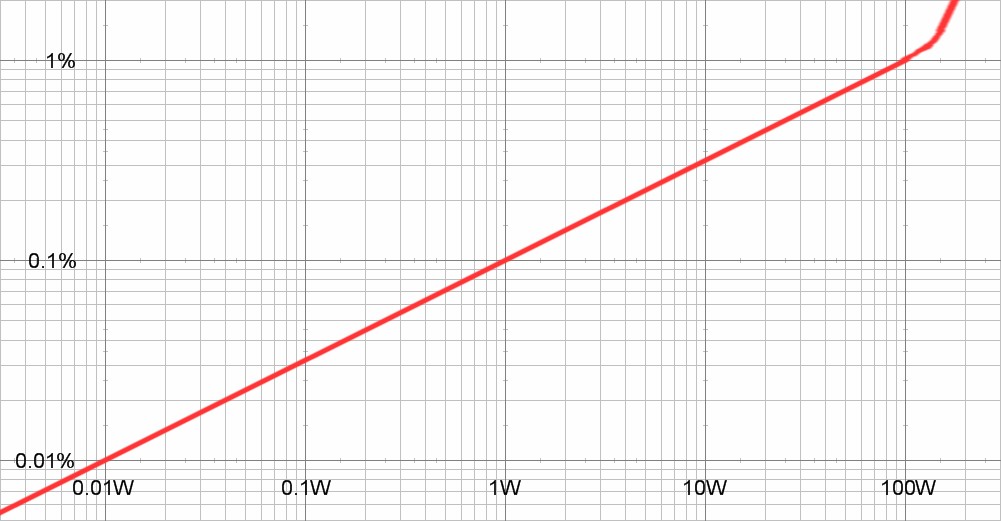 |
Class B Analysis
Class B distortion tends to be at a fixed level without regard to
signal magnitude because crossover distortion dominates that of the
overall transfer curve. (Think of crossover distortion as a fixed
distortion region unchanged by signal magnitude.) Therefore
distortion decreases as power
level is increased.Approximate signal+error voltage equation with fixed error k:
| (7) |
|H(v)| = v + k |
Divide error by signal to get relation of distortion to voltage:
| (8) |
Dist(v) = |
k
v |
Given
| (9) |
v = |
PR |
Make substitution to show relation of distortion to power:
| (10) |
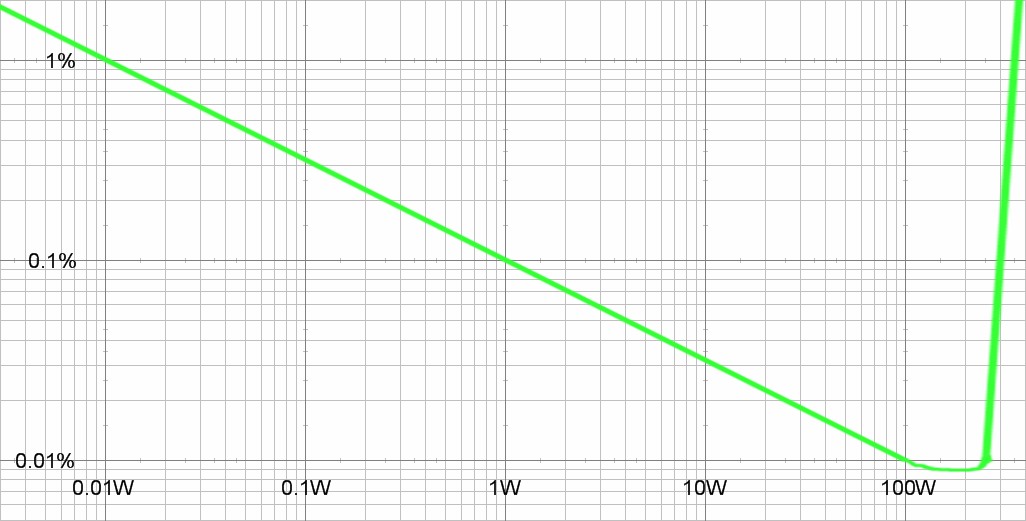
Dist(P) = |
|
| Figure
2:
Class
B
distortion
declines
with
power
until
onset
of
saturation |
 |
Deductions
| Figure
3:
Comparison
of
distortion
profiles |
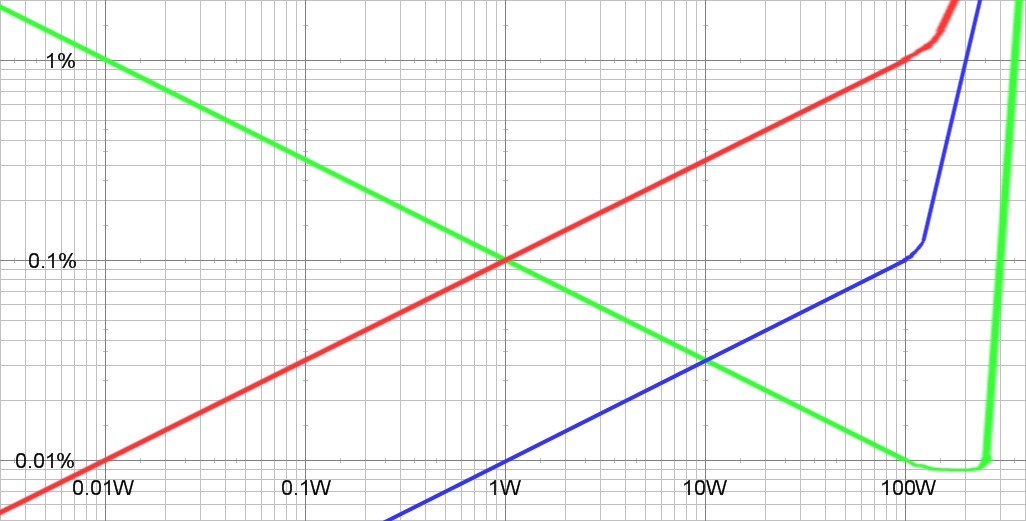 |
Distortion profile legend:
|
Since distortion varies with power level, it becomes obvious that distortion specified at maximum power favors class B amplifiers. Because speaker efficiencies average about 89dB/W, the distortion of ordinary listening done at power levels of only a few watts is not represented by maximum power distortion specifications.
From the graph above, the euphonic amplifier has as low distortion as the lower distortion class-b amplifier at the important 1W level. The neutral class-a amplifier excels the lower distortion class-b amplifier everywhere below 10W.
Other observations are to be made as well.
- Because class-a distortion diminishes with level, class-a has a clearer window to the smallest musical details that class-b cannot show.
- Because distortion adds apparent brightness, the effect differing with frequency, increasing distortion with magnitude in class-a amplifiers may create an impression of dynamic range expansion, whereas the inverse relationship in the class-b amplifier may create an impression of dynamic range compression instead.
- Natural distortion processes, as internal to musical instruments and even in the nonlinear compressibility or compliance of air, are the same in nature as class-a distortion. The human brain might be expected to be more accepting of natural distortion tendencies than contradictory ones, perhaps perceiving them to be more pleasing.
- Listening habits may chose an amplifier class having the least
distortion at the listener's normal listening level. Thus the
classical listener listening to many soft passages in the context of a
wide dynamic range may lean toward class-a while those preferring
highly compressed and perhaps loud music find no fault listening to his
class-b amplifier. (This is a much more subjective and less
certain statement than the rest.)
In the end, I may only be entertaining you with ideas that most of you already know.
|
|
2It is well known that FETs and vacuum tubes have square law distortion characteristics. Less obvious the BJT.
The exponential in the Ebers-Moll equation IE
= IEO(e40V - 1) is well known for its Maclaurin
series:
| ex = 1 + x + |
x2
2! |
+ |
x3
3! |
+ | x4
4! |
+ ... + | xn
n! |
+ ... | , where n! is the product of all
the number from 1 to n. |
This equation holds the potential for a high order error
term especially as the voltage in the exponent is multiplied by 40/V (=
1/VT ≈ 1/25mV). Fourier
analysis shows progressively greater suppression of higher order
harmonics with increased bias and local feedback until the second
harmonic becomes dominant.
Document History
October 2, 2011 Created.