InfoVis 2005 Contest
Boom
and Bust of Technology Companies at the Turn of the 21st Century
Contest webpage: www.public.iastate.edu/~hofmann/infovis/
Authors and Affiliations:
- Heike Hofmann, Iowa State University, hofmann@iastate.edu
- Hadley Wickham, Iowa State University, hadley@iastate.edu
- Dianne Cook, Iowa State University, dicook@iastate.edu
- Junjie Sun, Iowa State University, jjsun@iastate.edu
- Christian Röttger, Iowa State University, roettger@iastate.edu
Tools:
- R especially packages RMySQL, maps,
maptools, RColorBrewer, ash
- GGobi
- MySQL
- Manet
Data description
This data contains information on 84472 technology companies between
1989-2003. The companies produced 154912 unique products in this period. This
period of time is notable for technology innovations such as the rise of the
internet, the dot-com bubble and crash, Y2K, the 9/11 tragedy and changes
between democratic and republican control of government.
TASK 1: Trends and multivariate relationships
1.1 Trends in technology companies and products over time
1.2 Trends by industry type
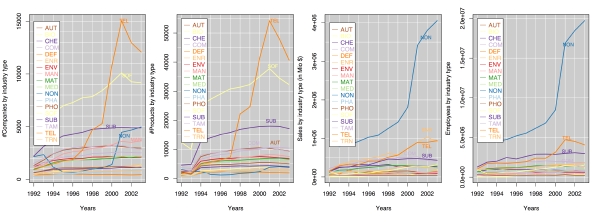
- Process: Each of the variables is tabulated by industry type and
year. Results are plotted as overlaid lines in separate plots for each
variable. The timeline starts at 1992 because the industry type is not defined
until then.
- Image:
- Insights:
- Companies: There is a dramatic increase in the number of
telecommunications companies in 1999 to a peak of 650 million in 2001. The
number of software companies is high throughout the time period, with a
sharper rise 2000-2001 and then a drop. Subcomponent companies were the
second highest industry type until 1999, and the number of these companies
levelled out at 200 million from 1998. A curiousity is the industry type NON
(primarily non-technology companies). It has a suspiciously political
pattern: the number of NON companies drops at the beginning of Clinton's
years and stay low until 2000.
- Products: The number of products by industry type is very similar to the
number of companies.
- Sales: The dominating industry type for sales for the entire period is
NON (primarily non-technology companies). This is a surprise because we
would not have expected this seemingly miscellaneous industry type to be
dominant in sales. Perhaps these are companies that have a broad variety of
products, of which technology products are a subset, but sales are recorded
across all. There is a dramatic increase in sales for this industry type
after 2000. The next two largest categories in sales are telecommunications
and energy.
- Employees: The patterns for employees follows those for sales, in
primarily non-technology companies and telecommunications. Subcomponent
companies are the second biggest employers until 2000 when they get bumped
by telecommunications.
- Caption for exhibit: Overview of number of companies, products,
volume of sales and number of employees by year and industry type.
1.3 Is there anything between the East and West Coast?
- Process: The density of company counts was computed with respect to
geographic location, for each year. The results are displayed as colored maps
and animated over time.
- Image:
- Insights:
- Results in absolute scale give insights into the geographic areas that
dominate the country - ie the East Coast and California. Apart from that,
Seattle, the Twin Cities, Chicago and Houston are visible.
- Steady growth is visible along the East Coast between Boston and
Washington D.C. as well as on the West Coast in San Francisco and Los
Angeles until 2001. After 2001 this trend inverses and these areas fall
victim to huge decreases in the number of companies.
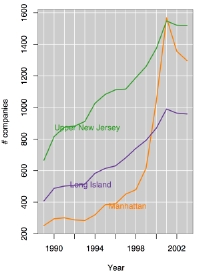
- Losses in the East are localized with their center in Manhattan.
Manhattan loses 14% of its technology companies in 2001. Close by areas such
as Long Island and Upper New Jersey do not show similarly dramatic losses.
- Caption for exhibit: Growth and decline in number of companies by
geographic location are displayed on a map of the U.S. Steady growth in the
number of companies occurs along the East Coast and California. After 2001
these areas show huge losses in the number of companies. The losses along the
East Coast have their center in Manhattan, which loses 14% of all of its
technology companies.Center of the losses on the West Coast is San Francisco -
16% of all companies are gone until 2002. Losses on the East Coast are
different insofar, as dramatic losses are restricted to Manhattan, whereas
both Long Island and Upper New Jersey see only very slight losses in the range
of less than 10%.
TASK 2: Clusters
2.1 Is local growth fueled by natural disasters?
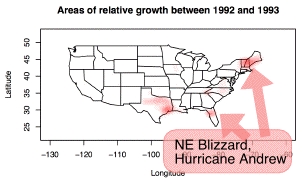
- Process: The density of relative company counts was computed with
respect to geographic location, for each year. The results are displayed as
colored maps as small multiples and animated over time. Relative growth is
measured as the difference in the number of companies of two consecutive years
divided by the number of companies in the earlier year.
- Image:
 Animated
gif
Animated
gif
- Insights:
- The relative scale tells about pockets of locally dramatic increase in
technology company activity.
- Some of these pockets seem to coincide with weather related disasters -
between 1992 and 1999 all but one area can be matched with floods,
hurricanes and other mostly weather related disasters. This points to
federal emergency funds as a stimulant for local growth.
- Relative growth is high in various areas between 1998 and 1999. This
coincides with the boom of internet/web related technology.
- Caption for exhibit: The density of relative company counts was
computed with respect to geographic location, for each year. Results are
displayed as colored maps and animated over time. The relative scale reveals
pockets of locally dramatic increase in technology company activity. Many of
these appear after natural disasters.
- Supporting
information
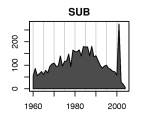
2.2 Software is out -- services are in
- Process: Top 20 products were picked for each year, where top
products were defined to be those products offered by the most companies. The
development of each of these products is shown between 1989 and 2003 in
absolute number of companies (left) and their relative market share (right).
- Image:
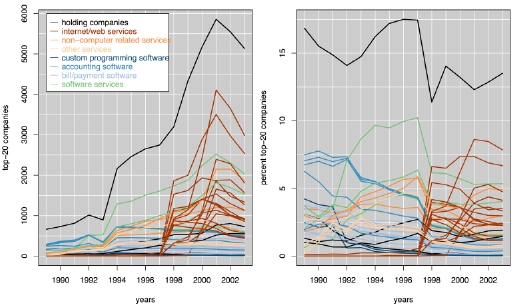
- Insights:
- Top products are very stable - between 1989 and 2003 only 45 different
products appear among the top 20 products at least once.
- The number of companies offering one of the top products increases over
time, indicating that market competition is becoming stronger.
- Products can be classified mainly as either service or software. The
number of companies offering software products is very stable over time, the
number of companies offering service products increases dramatically over
time. Companies offering internet/web related services take the market by
storm after 1997. After 2001 the number of companies offering services
decreases for all products, following the general trend of the market.
Software companies do not follow this trend but remain stable.
- "Losers" are companies offering custom application software, "winners"
among software products are software services.
- Top 20 services offered from the beginning of the time period are
non-computer related: waste management, soil or water analysis.
- Holding/parent companies are ranked number one throughout the time
period.
- 1993 wasn't a good year for high-tech products - the number of companies
takes a dip across all top products. .
- Caption for exhibit: Line plots of top products between 1989 and
2003. Products shown are among the top 20 products (i.e. products offered by
the most companies) at some time between 1989 and 2003. Shades of orange
indicate services, shades of blue indicate software products. The three green
lines are software services. Black lines correspond to holding companies.
Overall, the number of companies offering one of the top 20 products increases
(sign of higher competition?). Early on, most products are software related
products - after 1997 services dominate the market. Custom programming
software products seem to take the worst dip of all - they seem to drop out of
fashion after 1991. While other software products still increase slightly,
they do not experience the boom of service products. The only software
products that do particularly well are software services (green lines), which
seem to jump on the service bandwagon. On the other hand, software products do
not seem to suffer from the same decrease after 2001 as almost all of the
service products. The dark red lines are internet/web related products. They
exist only after 1997 (some relationship with Windows 97?) and take the market
in a storm. Orange colored products correspond to non-computer related
services, such as waste management, soil analysis and water analysis. These
services existed from the beginning of the time period and remain among the
top 20 products throughout.
2.3 High market concentration in biochemical companies
TASK 3: Unusual features
3.1 There's something strange about Harris County, Texas!
- Process: The numbers for each county for each year are aggregated
yielding summary statistics for each county: number of companies, number of
employees, volume of sales, number of products, number of different products.
Summary statistics over the time period for each county are produced to
characterize the longitudinal data. Geographic location, using latitude and
longitude, is added to the county summaries. The data is compiled into an xml
metadata set for ggobi, so that different aspects of the data can be probed
quickly. The strange pattern in Harris County was investigated further by
making detailed calculations in R, subsetting the data into just Harris County
and making further calculations.
- Image:
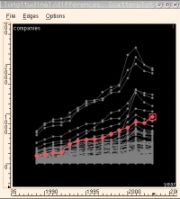
- Insights: Most counties follow a pattern of increasing number of
companies over time, and a strong drop after 2000. There is one noticeable
expection to this pattern: Harris County, TX. This county has a dramatic
increase of 110 companies from 2000-2003, which represents a 14% increase.
There is only one other county with an increase or more than 10 companies
during this period. Is there something unique in Harris County, TX? Harris
County, TX, is the home of the Johnson Space Center. It is also the county
where George Herbert Walker Bush claims a homestead exemption on his
residence. The increase in number of companies is explained mostly by a 50%
increase in energy companies, from 117 to 172, with 26% (62 to 91) explained
by primarily non-technology related companies. (Aerospace companies are
included in this industry type.) Sales and number of employees increase from
2001-2003 but not so much differently from other counties. The number of
different products jumps, and this is noticeably different from other
counties.
- Caption for exhibit: Harris County, TX, has a noticeably different
trend than all other counties after 2001. The number of companies in the
county actually increases, by 110 companies from 800, by 14%. It is the home
of the Johnson Space Center, and also of G. H. W. Bush.
- Supporting
information
3.2 Sales switch up between counties in Detroit, MI
- Process: The same county aggregated data is used, focusing on
sales. The extreme values are sequentially filtered by hiding the county with
the highest sales in the plot. (This includes New York County, NY, Cook
County, IL, Hennepin County, MN.) A strange pattern was revealed and we
investigated this by highlighting the counties involved and zooming in on a
map to explore the geographic location.
- Image:
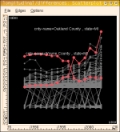
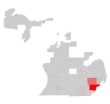
- Insights: One county, Wayne County, MI, has a strange sales
pattern. It has strong but flat sales from 1989 to 1997, and then drops
dramatically. On closer inspection there is another county with the inverse
pattern, which is Oakland County, MI. Both counties are in Detroit, MI. The
switch is observed in the zoomed map view of the state: from 1997 to 1998 the
high sales switch from Wayne to Oakland County. One reason for this switch
might be the activities of the Mayor, Dennis Archer.
- Caption for exhibit: Wayne County and Oakland County, MI swap the
dominance of sales between 1997 and 1998.
- Supporting
information
3.3 Strange Values for Market Concentration
- Process: The HHI (introduced in Task 3) is plotted against year.
Results are displayed as line plots, with and without the outliers. Further
calculations are made to check the data.
- Image:
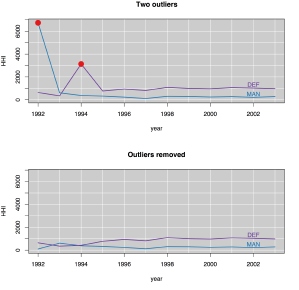
Two outlier values (red dots in top picture) excluded in bottom
picture
- Insights: Two industry types, MAN and DEF, stood out by exhibiting
sudden, huge jumps in 1992 and 1994, respectively. The results were
recalculated after excluding the two sales values which caused the jumps. In
both instances, one firm has ten-fold increases in sales for one year,
followed by a fall back to original levels the next year. This gives it a
near-monopoly HHI score for that year explaining the HHI spike.
We might be tempted to speculate about the NATO mission in Bosnia etc. But
the high sales represent a tenfold increase, falling the year afterwards to
the former level and staying there. Therefore we suspect errors in data entry
here.
- Caption for exhibit: HHI is plotted against year measuring the
amount of market concentration. There are two extreme values in industries MAN
and DEF. Together with the fact that the high sales figures are strictly
one-off, a tenfold increase followed by a fall back to original levels, we
suspect an error in data entry here.
TASK 4: Other findings
Data cleaning
We spent of lot of energy early in the data release
finding anomalies in the data and reporting these. This resulted in numerous
revisions of the competition data. Some of the problems were fixed but there
still seem to be numerous problems with this data. WIth data sets of this size,
mainting quality is a very difficult problem. Here are some of the
irregularities we found:
4.1 Can so many companies really be founded in 2000?
- Process: The counts for companies founded are plotted against
years, together and separated by industry type.
- Image:
- Insights: There is a big spike in number of companies founded in
the year 2000. This doesn't look plausible. It exists before and after the
final data cleaning for the competition. The spike exists for every industry
type. In the original data the number of companies founded in 1999 is 4081 and
it jumps to 13433 in 2000. In the cleaned data the number of companies founded
almost doubles from 4132 in 1999, to 7352 in 2000, and then drops to 804 in
2001. This is extreme behavior!
- Caption for exhibit: Counts for companies founded are plotted
against years separated by industry type. The year 2000 has an implausible
spike in number of companies founded, across industry type.
4.2 Why are there companies in the database before it is founded?
- Process: Founding year is plotted against the first year in the
database. The values are jittered slightly to spread ties apart.
- Image:
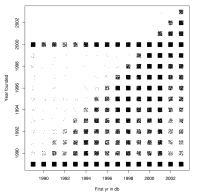
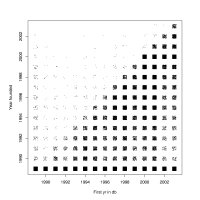
- Insights: Notice the points above the diagonal, in the upper left
half of the plot? There are many companies founded after they appear in the
database. Year 2000 is particularly problematic. The left plot shows the
original posted data, which has more problems. The right plot shows the final
competition data after cleaning. After the data cleaning, there are still 504
companies that appear in the database before their founding year.
- Caption for exhibit: (Left) Data before final cleaning. (Right)
Data after final cleaning. Founding year plotted against first year in the
database, with ties jittered slightly. There are many companies who appear in
the database before they are founded. In the revised data set this got
improved but still exists.
Conclusions
We were very surprised by many of our
observations on the data. Initial disbelief was followed by intensive number
crunching to check the values and extensive internet searches to find plausible
explanations. Particularly, the potential relationship of local growth in
companies with natural disasters and the increasing trend in the number of
comapnies in Harris County, TX, did come as surprises.
We arrived at the association of natural disasters and local hot spots by an
astute observation by one of the team members. The chaotic popping up of hot
spots around the country looked spurious, until one person asked at the 93-94
hotspot in Iowa: "When were the floods in Iowa?" This led to extensive searches
of geographic locations and natural disasters, and it cascaded into ways to
explain many hotspots. Mostly, these could be found in the 93-99 period when
Clinton was in government. Only then we started to come across accusations in
online news stories about suspect use of FEMA funding during the Clinton
administration. Letterman cracked a top 10 joke related to FEMA. Not all of the
hotspots can be explained this way. We would also like to point out that this
association between local economic activity and disasters is purely a proposal,
not a conclusive finding.
The results on Harris County, TX, arose immediately from the longitudinal
plots of county counts. The trend stands out in the graphic, in a manner
probably not so detectable numerically. Checking the numbers and finding no
other county in the USA that is even close to this trend was also a surprise.
Identifying it as a county in Texas, was a tad surprising, and even further
surprising to find accidentally that it is the residence of the current
president's dad. There are many attractions, such as the Johnson Space Center,
in Harris County, but this association raises big questions about political
influence.
When we started exploring the data, we expected to see the bubble pop in
Silicon Valley, some economic effects in the New York region after September 11,
2001, the effects of Microsoft developing in the Seattle area. And we saw these.
We also had other expectations that did not pan out: companies that move a lot
might be more likely to go bankrupt (disappear from the database), that there
might be movement from away from the coasts after the bust to the mountain
states and the Midwest. There is some movement of companies but these results
were less interesting.
Comments
Thanks to Georges Grinstein, Urska Cvek, Mark
Derthick and Marjan Trutschl for such intriguing data, and the enormous amount
of work that was clearly needed to pull it together. 


